ARRAY-BASED MULTI-ATTRIBUTE
MONITORING (MAM)
Head to head sample comparison made easy
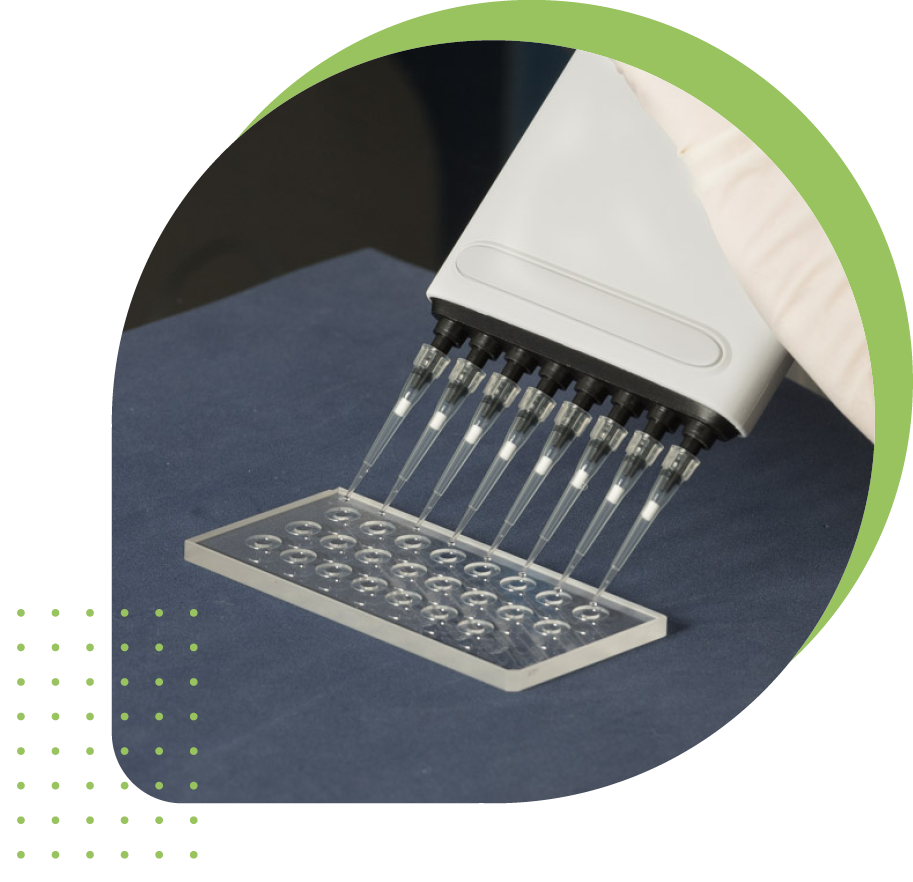
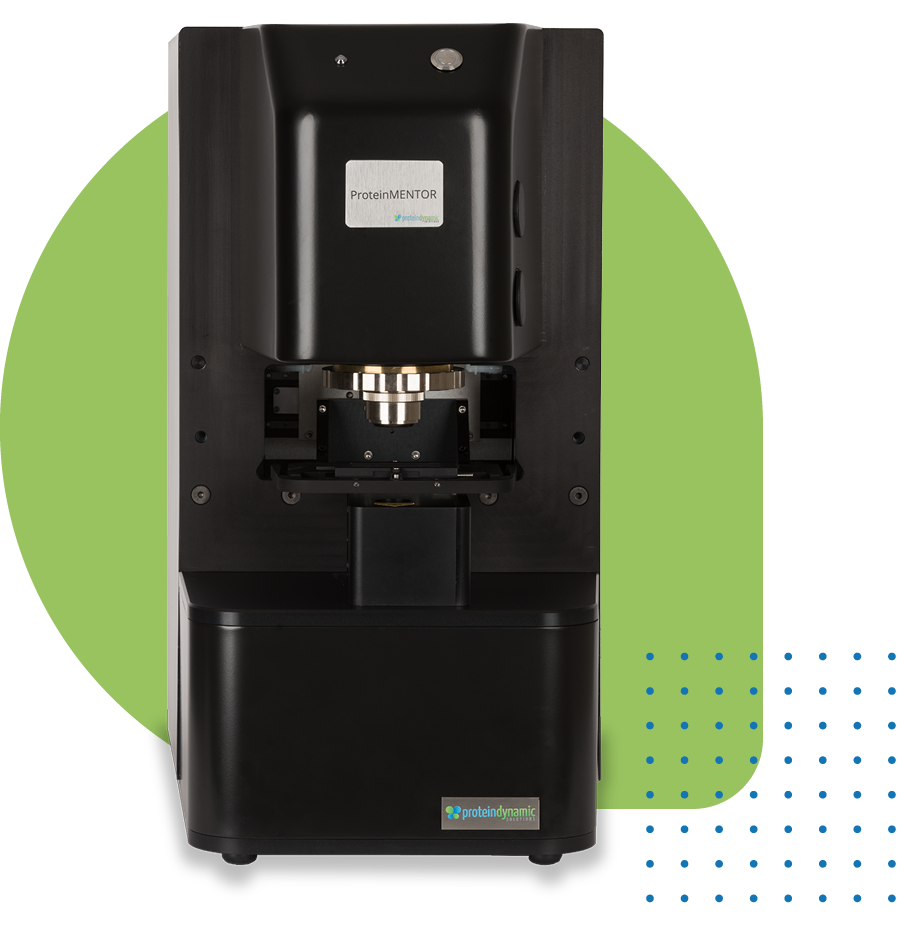
The ProteinMentor® platform uses an array with 21 samples and 2 controls for head-to-head comparison of samples across a range of stressor conditions.
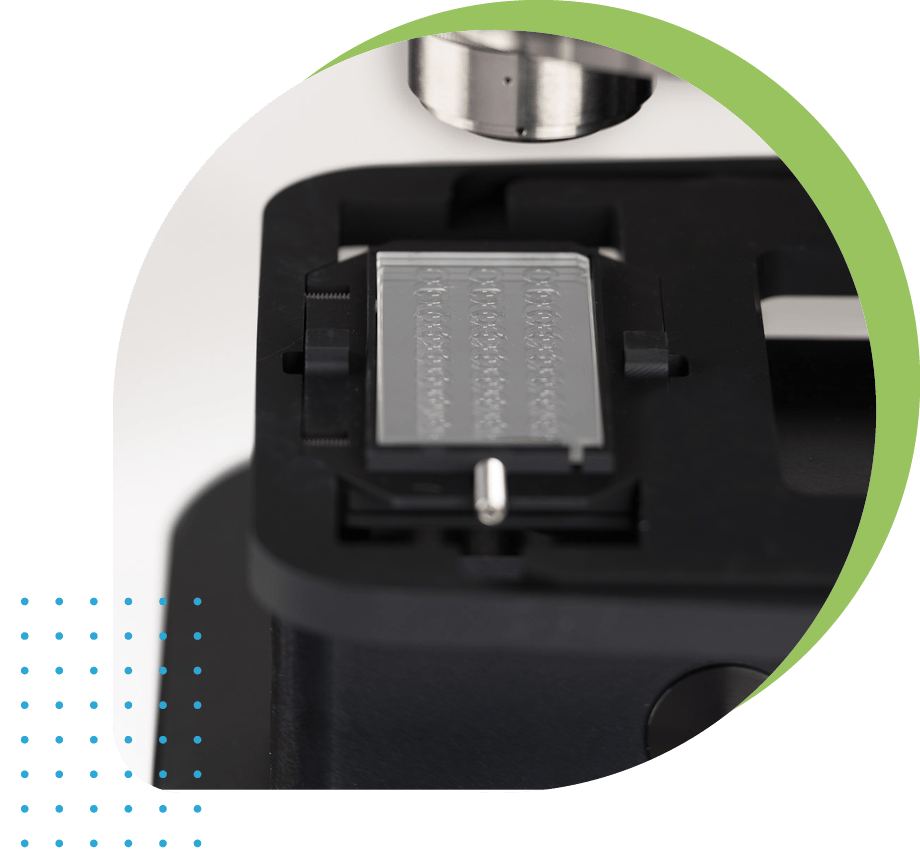
The sample slide is held in a rugged, temperature - controlled holder such that all of the samples in the array can be subjected to the same agitation or temperature stress and assessed for comparability or relative stability and developability.
Flexibility in Experimental Design
MANIPULATING AND ANALYZING AN ARRAY OF SAMPLES AFFORDS TRUE MULTI-ATTRIBUTE MONITORING
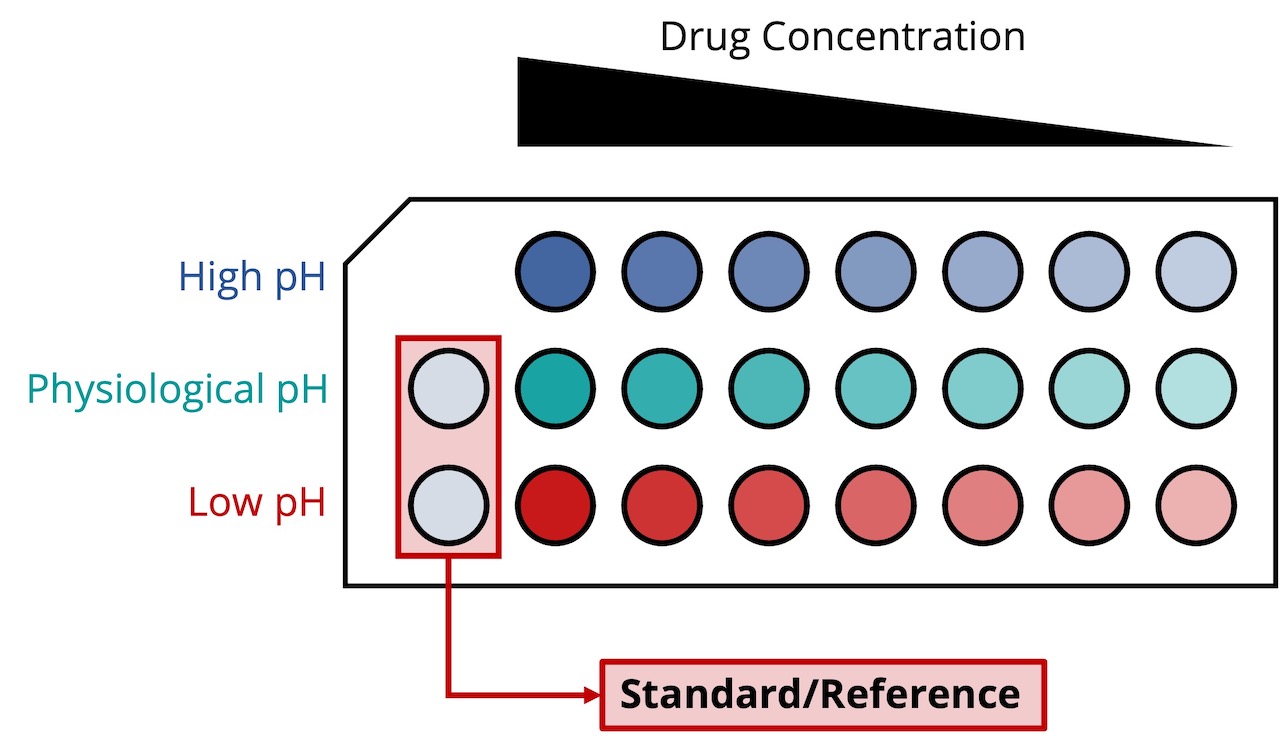
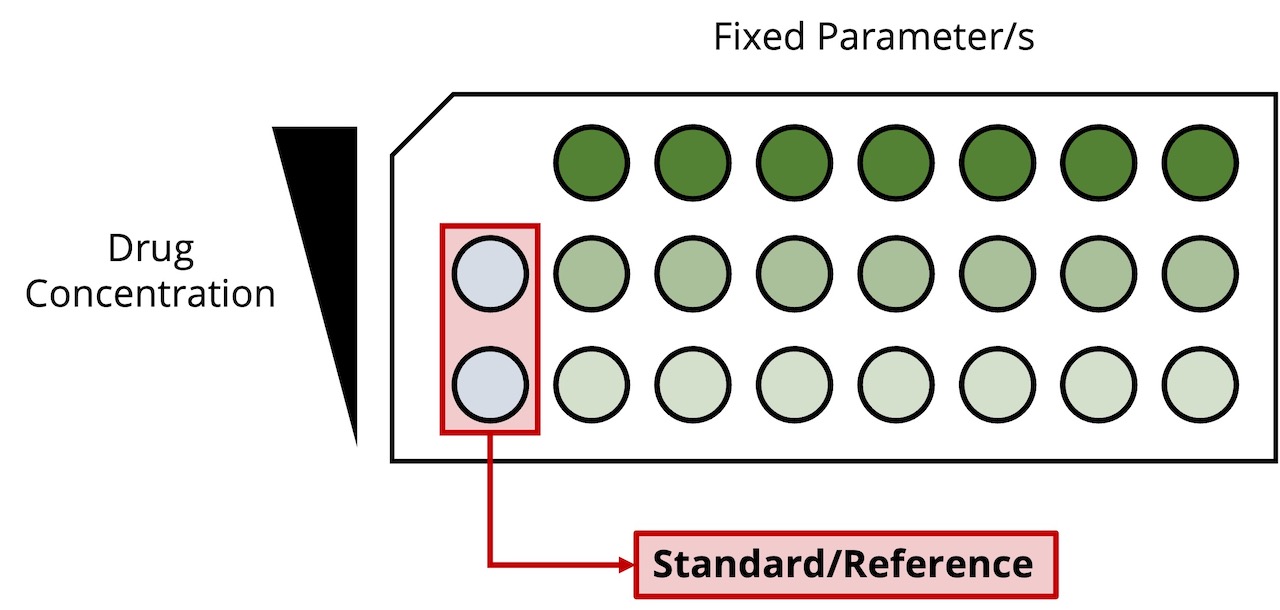
Design of experiment can include simultaneous assessment of the impacts of a variety of parameters such as pH, ionic strength, drug and excipient concentrations, buffer or formulation composition, agitation and temperature


ACCELERATED HYPERSPECTRAL IMAGE ACQUISITION & DATA ANALYSIS
Each well is scanned in turn, with data collection from 21 samples taking 90 seconds.
Once a baseline scan is obtained from each sample, a stress is applied and the protein changes determined via collection of difference-spectra.
Data can be collected and analyzed for a quick comparability screen for up to 21 samples in about 30 minutes or the samples subjected to an extensive heat-stress analysis to determine location and mechanism of change in about 3 hours.
COMPREHENSIVE DATA
For every sample well the following data are generated by the ProteinMentor software (see below):
1. A hyperspectral image, which may be interrogated to track and differentiate between extraneous contaminants and/or the formation of aggregates, disordered structures, crystals, etc.
2. A synchronous 2D IR correlation plot, the wavenumbers and intensities of the peaks informing which regions and specific amino acids are moving as a result of stress. This indicates the parts of the molecule involved in structural change such as instability, aggregation or ligand binding.
3. An asynchronous 2D IR correlation plot, the wavenumbers, colors and intensities of the peaks informing the order in which regions and specific amino acids are moving. This allows determination of the mechanism of structural change as a result of stress and may be actionable for logic-driven reengineering or formulation stabilization of the protein.
4. A traditional IR trace showing change of peak shape and maxima position over stress (such as steps in a temperature ramp)
5. A plot of the peak maxima for the protein of interest. This indicates the condition of onset of structural change, such as the transition temperature.
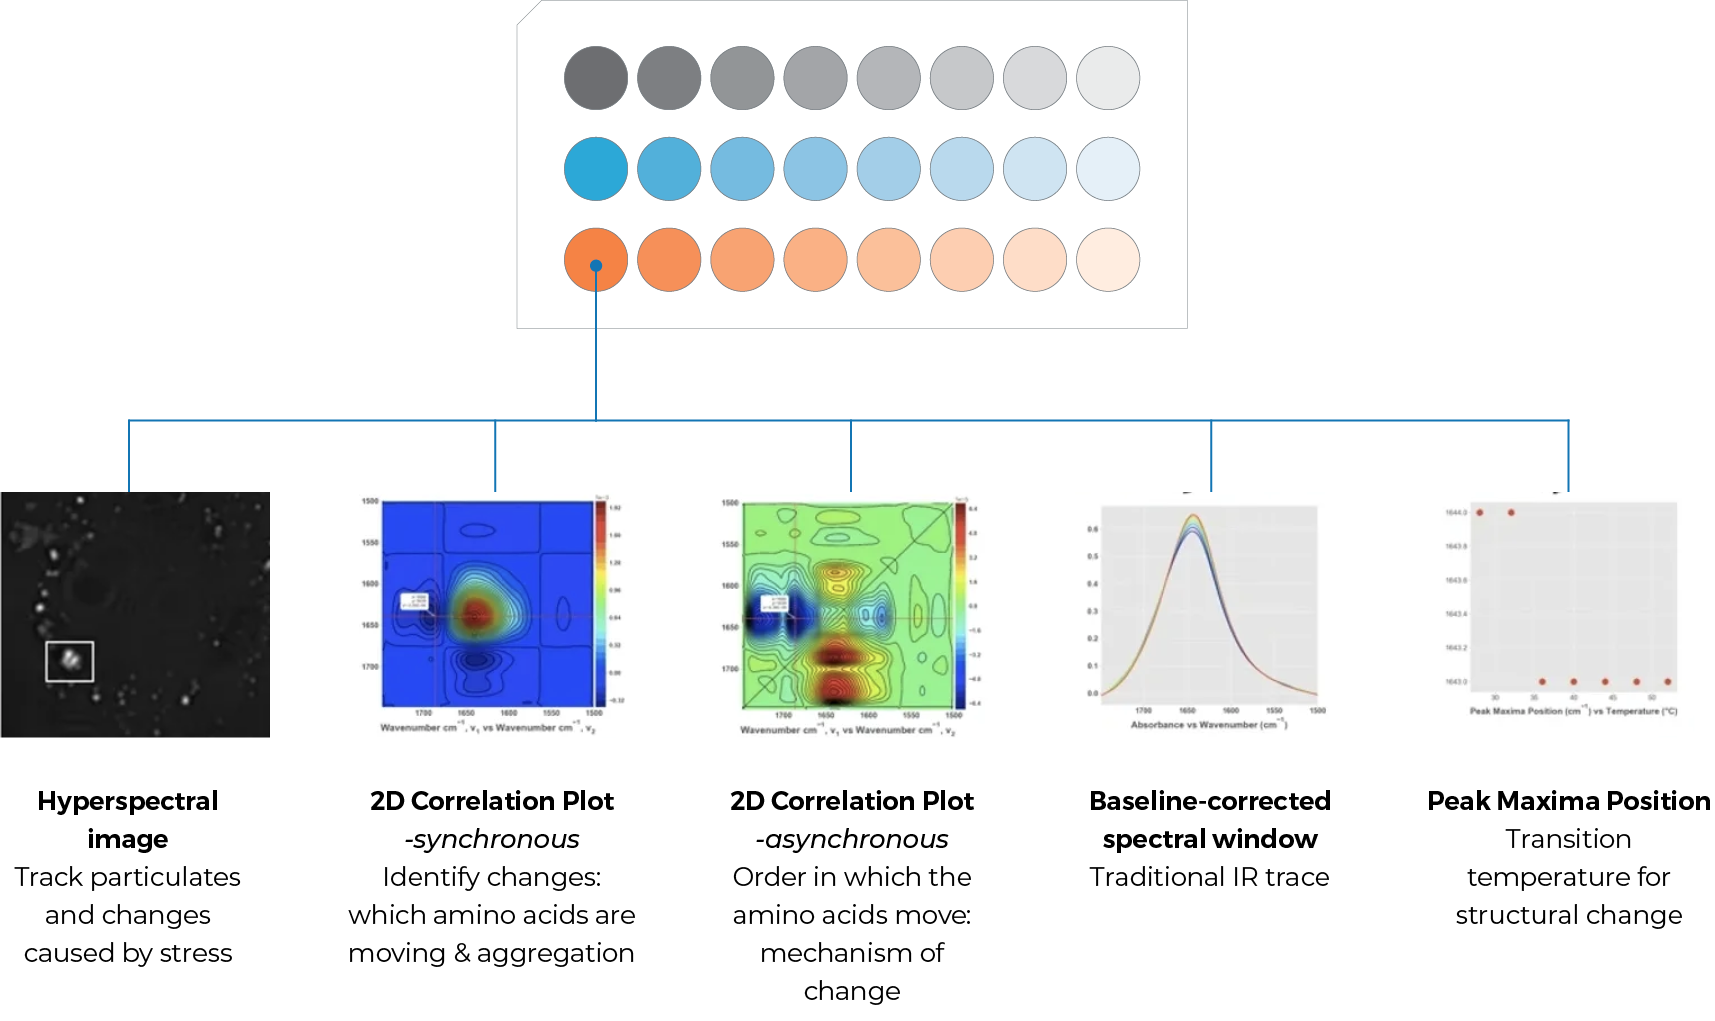
Each of these data types can be compared across the entire array for quick and easy rank-ordering of stability or to delve into the molecular behavior of the protein at secondary-structure and residue-level resolution.
Evaluate ProteinMentor for your CQA analysis
We are ready to host you at our Massachusetts facility just outside Boston.
Schedule a time to come to how easy it is!
Implement ProteinMentor for your in-house CQA analysis
Protein Dynamic Solutions is offering early-access customers an opportunity to implement ProteinMentor on site to support their candidate pipeline. We work closely with our clients to ensure their success in implementing this transformative technology for improved biologic development and generation of data for enhanced IP protection.
